This is a regular update my Now page. I publish them as a blog post for archive purposes. You can also view all my past now entries.
During my holiday break, I redesigned my blog post footer to include additional information such as a small about me bio and a subscribe block. Inspired by Rob Knight's post, I also added a popular posts block based on pageviews. However, since my website is built on Webflow, I discovered creating custom elements like this is notoriously challenging. I looked at a lot of forums that try to achieve this in Webflow, but very few helped. I thought it would be beneficial to document my process and put it out there so others can quickly implement it if needed.
The best part of this setup is that it keeps up to date automatically every week. You will need a Webflow account and website, of course. A Google Analytics account linked with your Webflow site and a Make account (formerly Integromat). There are more popular automation services out there like Zapier and IFTT but I prefer Make for their generous free tier and their visual whiteboard-style editor. Also, you could use any other analytics service, as long as it has an API or an integration with a service like Make. Sadly my favorite analytics tool, tynilytcis has none of those yet,
In short, I'm using Make to fetch Google Analytics views and then update the views field for every blog post in Webflow. This integration can run daily or weekly to keep your views up to date, and there is no need for a middleman like Airtable. I then designed and created the component and added it to the bottom of blog posts.
Adding a views field to the posts CMS in Webflow
For this post, I will assume that you already have your site and a Blog posts CMS collection with its pages set up.
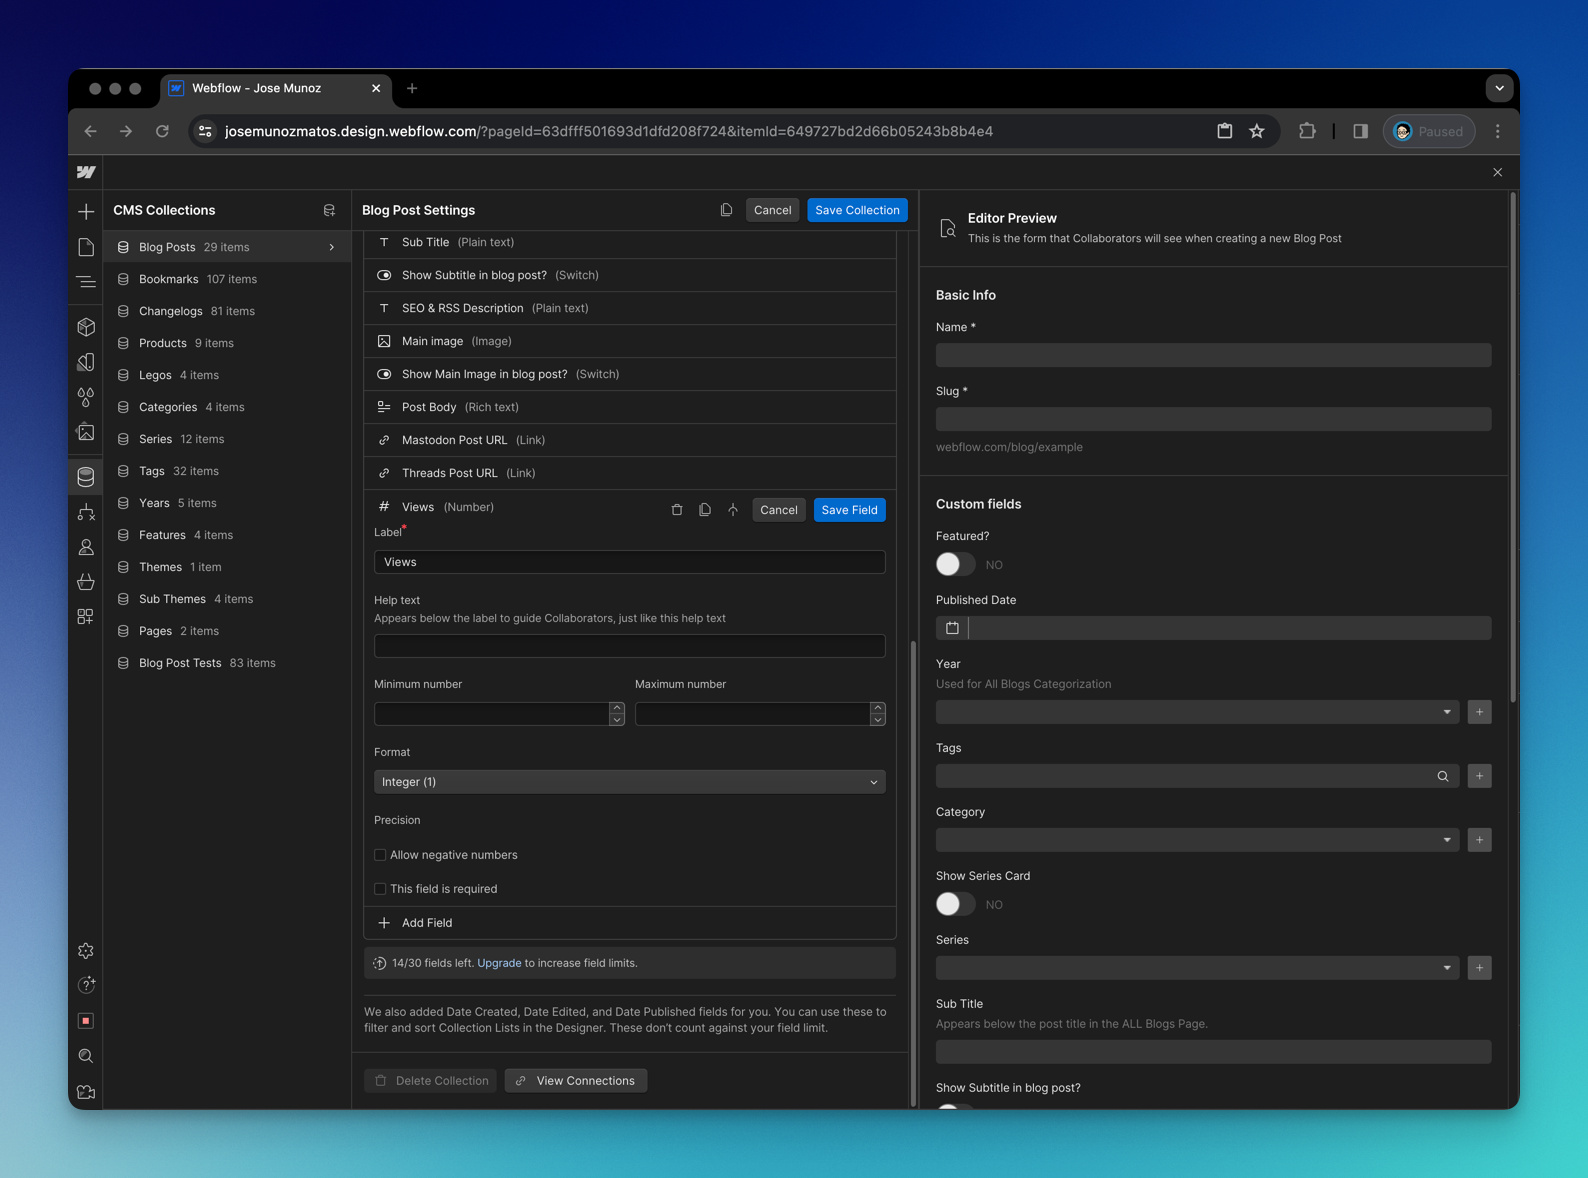
You need a place to store the views that we’ll eventually get from Make. To do that, create a new number field in your CMS collection settings. You can name it "page views". We will use this to eventually store the data. Then, you must set up a regular CMS collection inside your popular post block. Filter the collection so the active/current post does not show up. Then, sort the collection by the "Views" field and remember to limit how many you want to return.
Fetching views from Google Analytics in Make
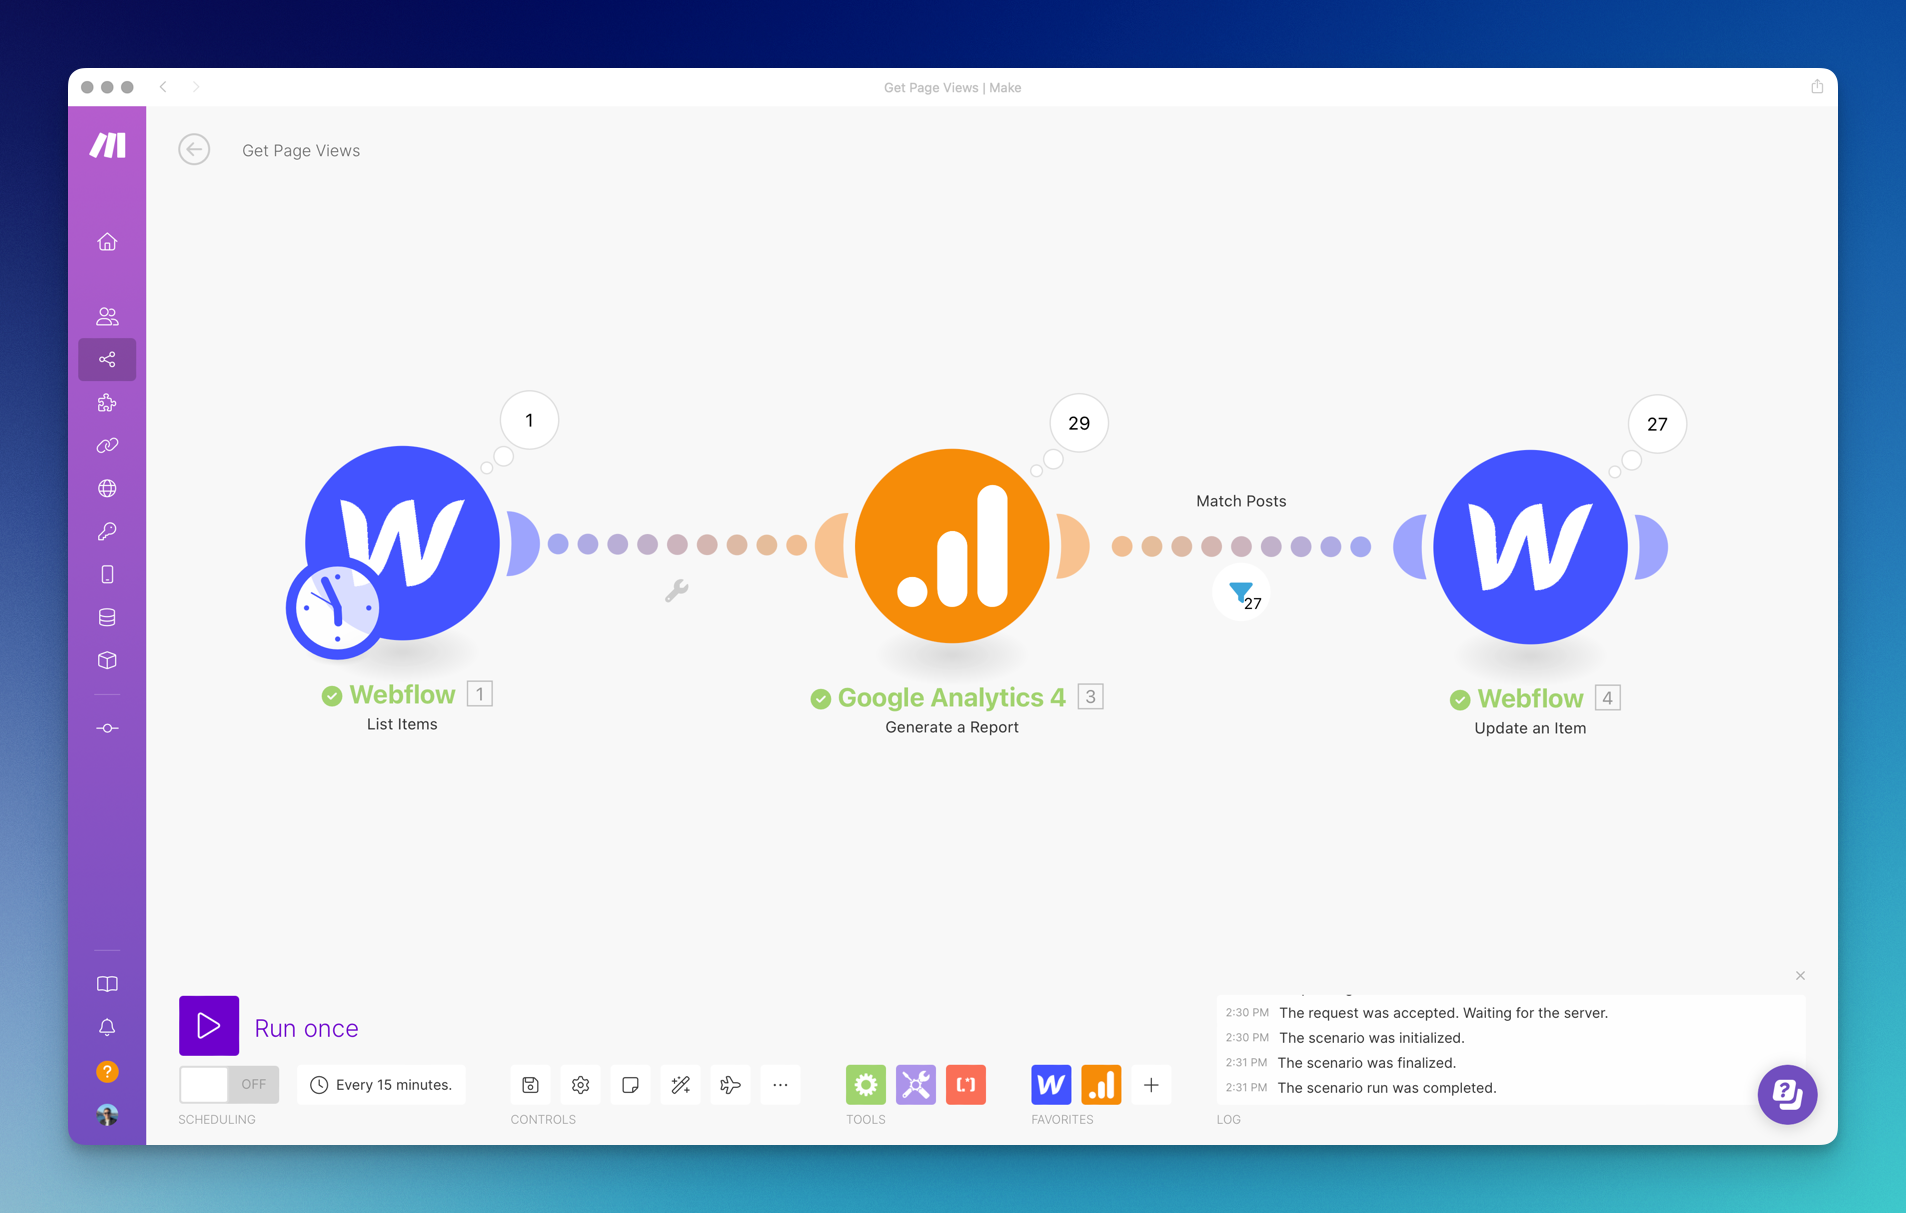
First, we need to figure out how to get the page views of our blog posts. Sadly, another downfall of Webflow is that it does not offer this feature. So, we have to rely on third-party analytics. For the Scenario you will need to create two connections: one for Webflow and one for Google Analytics.
1. Add a Webflow List Items module
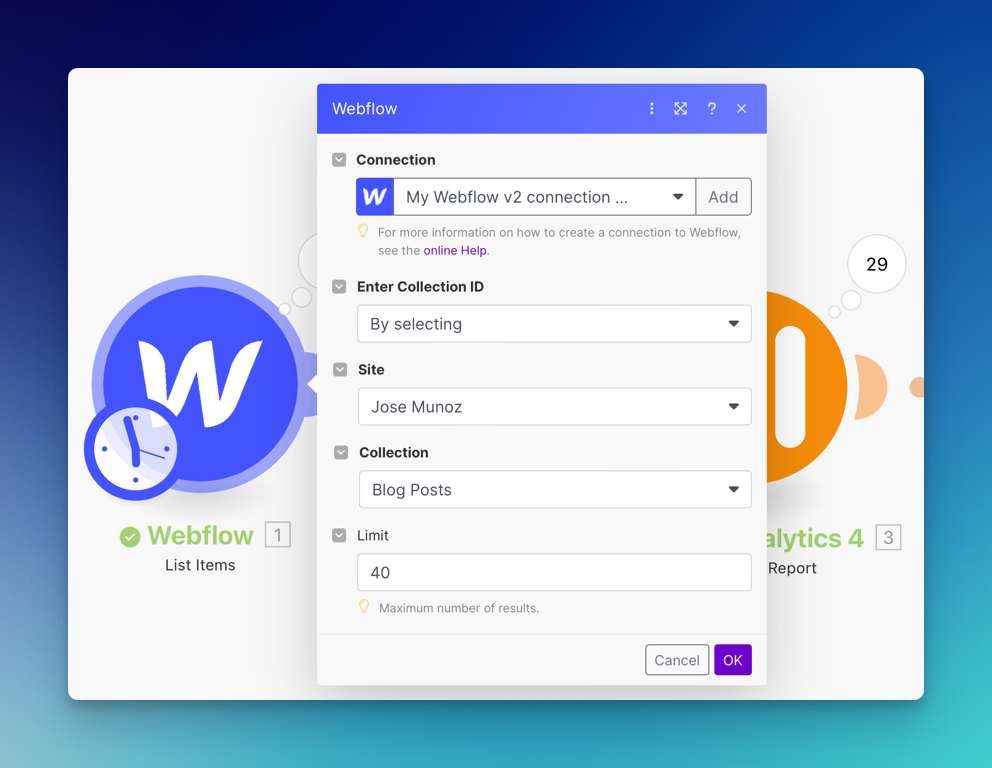
The Make scenario's first step is adding a Webflow List Items module. This will retrieve all the items in the specified CMS collection every time the scenario runs. I set it to a limit 40 to prevent the module from failing. We will use this to get the names of the most recent 40 blog posts.
2. Setup Google Analytics Module
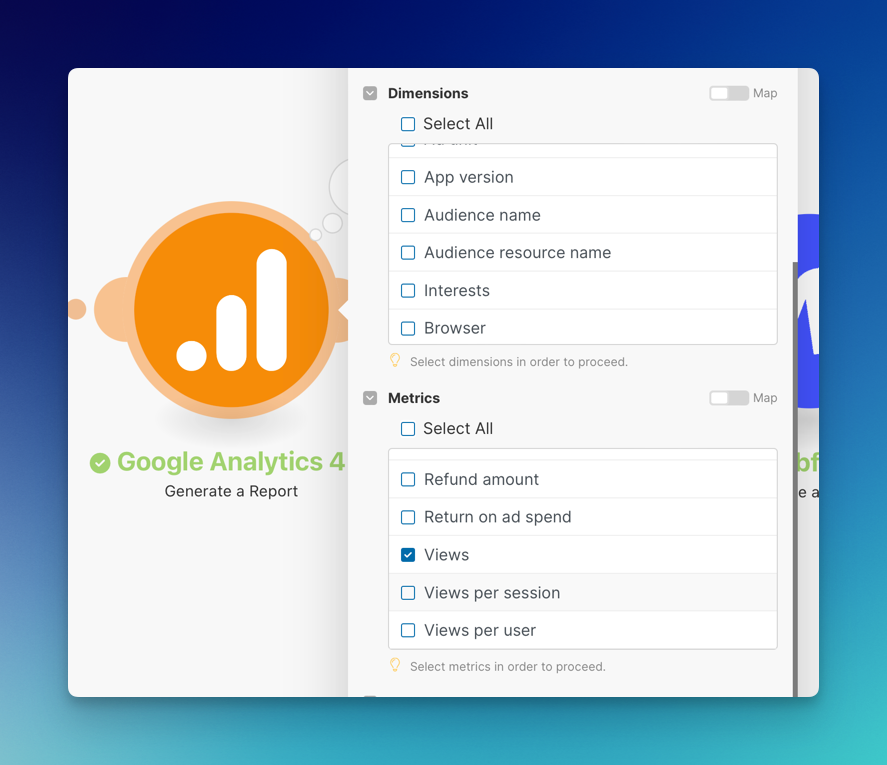
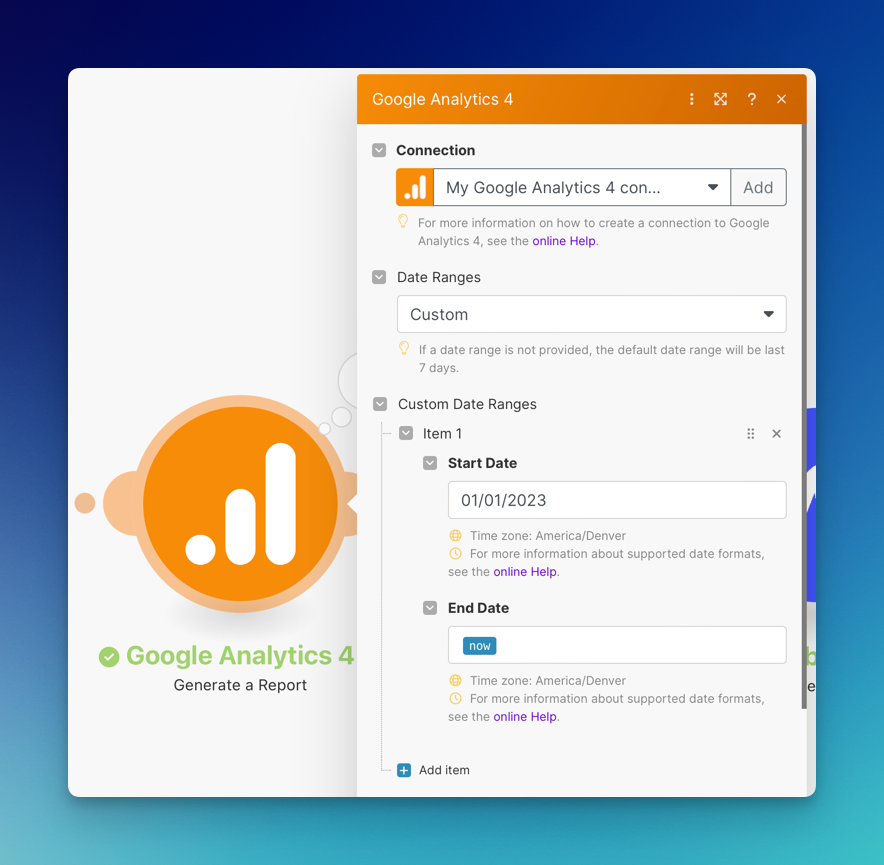
Then we need to add a Google Analytics Generate a Report and connect it to your account. (Setting up Google Analytics for your site is a very tedious process. I recommend this guide if you have trouble). Once the connection works successfully, you must set the date range and the metric you want to get. For the metric, we will select views. We want to get all-time data for the date, but there is no option for that currently, so we have to create a workaround. I selected to start from the date my website started, and for the end date, I used a Make variable, now, which should get the current date.
3. Filter for blog posts
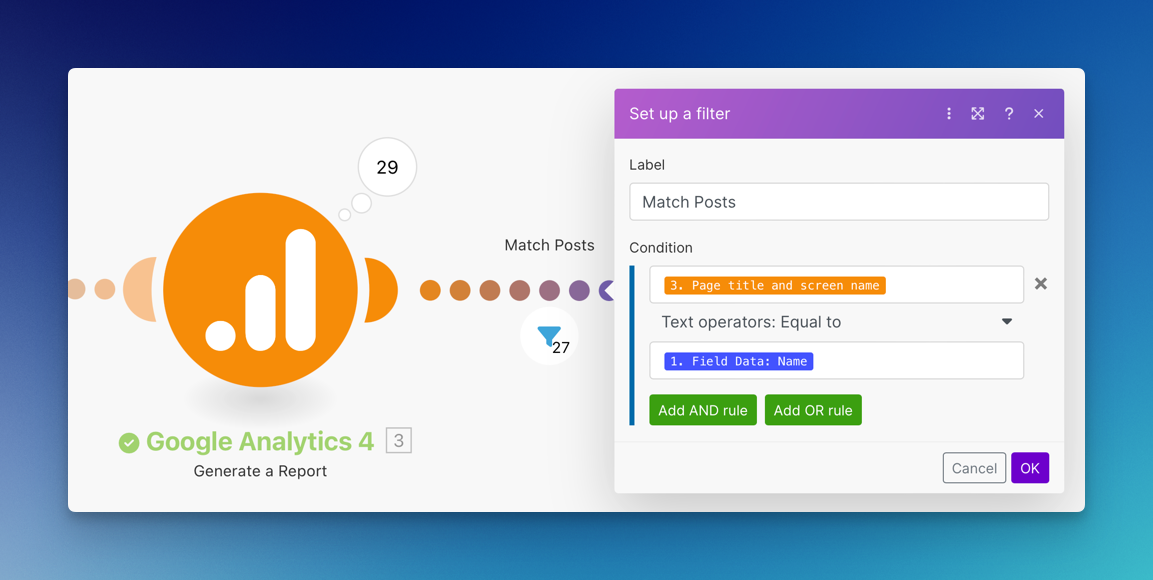
Keep in mind that this will gather data for ALL your pages, so we need to filter the module results. Right-click on the dotted line to add a filter. We want to extract the blog post's name and match it with the page's name from Google Analytics. This way, we will only receive data from the blog posts and not all the pages.
4. Setup an Update an Item Webflow module
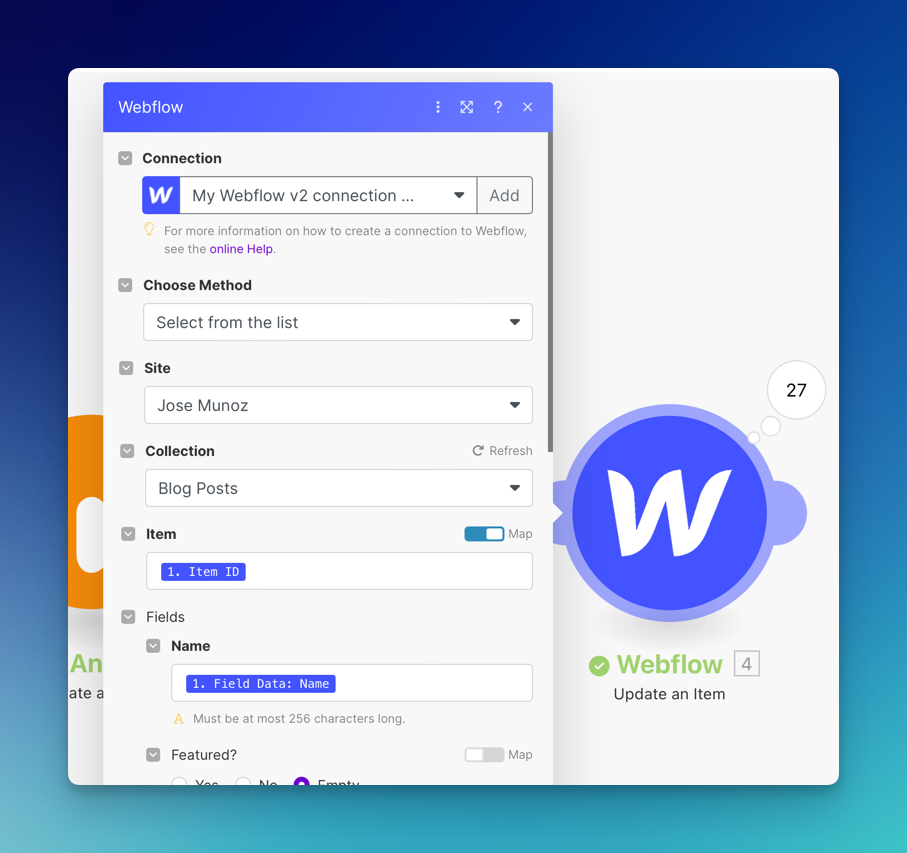
For the last part of the scenario, you need to add a Webflow Update an Item module so we can add the page views data to each of our blog posts. After selecting the site and collection, map the item id and name so it knows which post to update. Then, map the Google Analytics views data to your Webflow views field.

5. Schedule scenario to run weekly
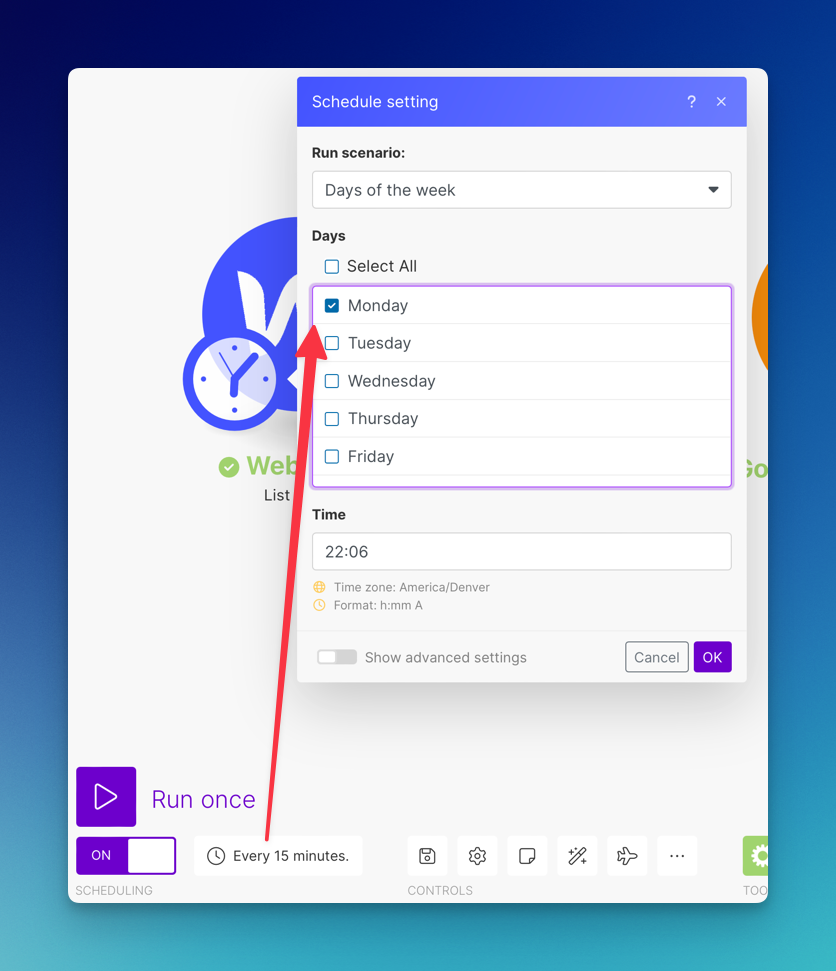
Finally, if everything works properly, set up the scenario to run on a schedule. I chose to run it weekly so it doesn't add too much to my monthly operations. You can create a free account and get up to 1,000 monthly operations.
Setting up the component in Webflow
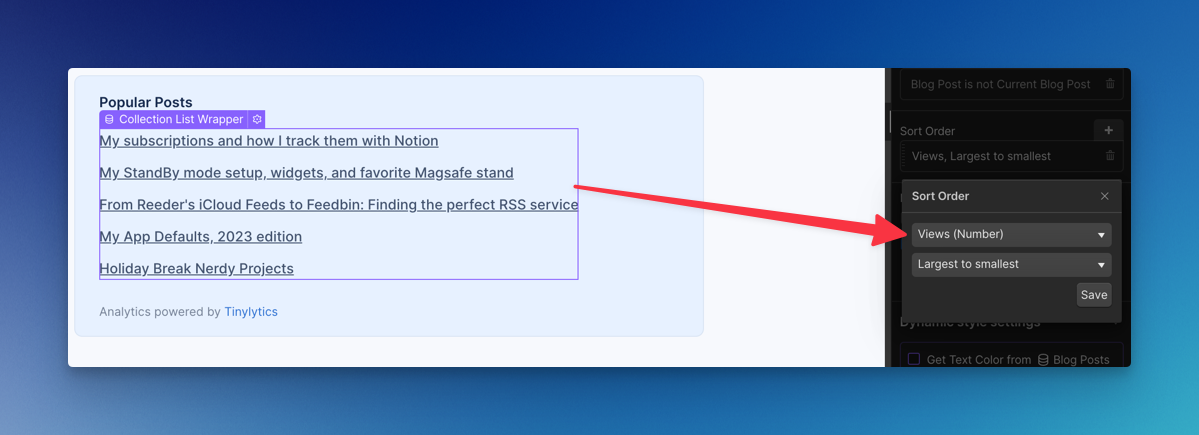
Once you have checked that it is running correctly, you can create the component in Webflow. Create and design the block to your liking. Then, make it a collection list and link it to your blog post collection. Now, this is where the magic happens. Because each of our blog posts now has a number field with the updated page views data, we can sort the collection list by that field so we have the most viewed posts at the top.
This is how our collection settings should look like:
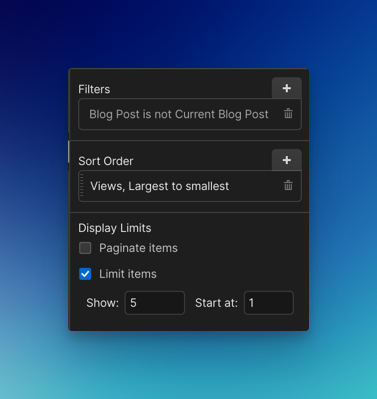
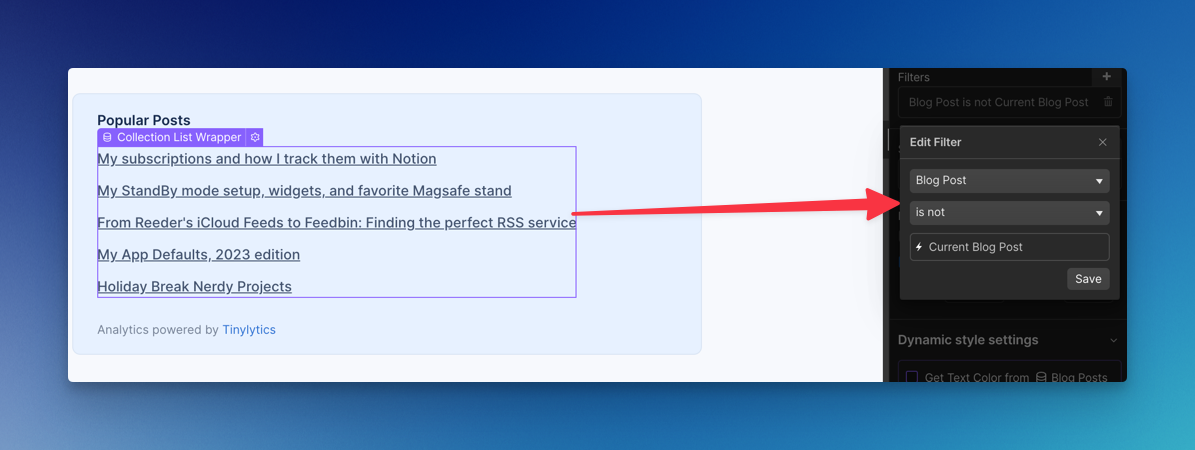
We want to exclude the post the user is currently on, so we need to add a filter set and select Current Blog Post. You can also limit the number of items shown; in my case, I selected to limit to 5.
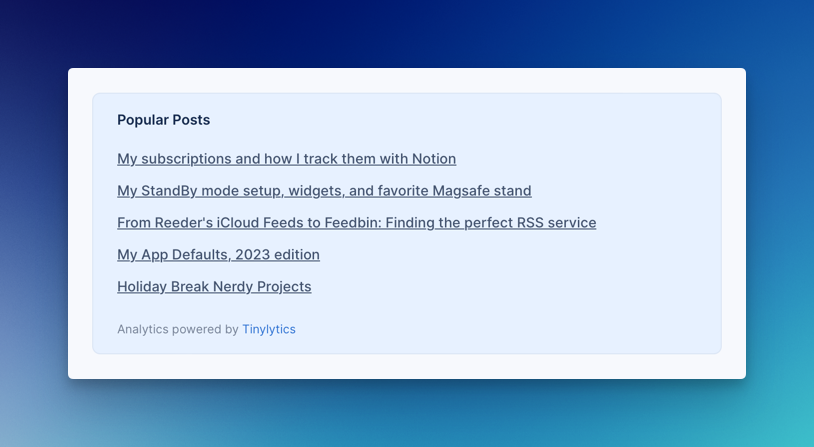
Final Result
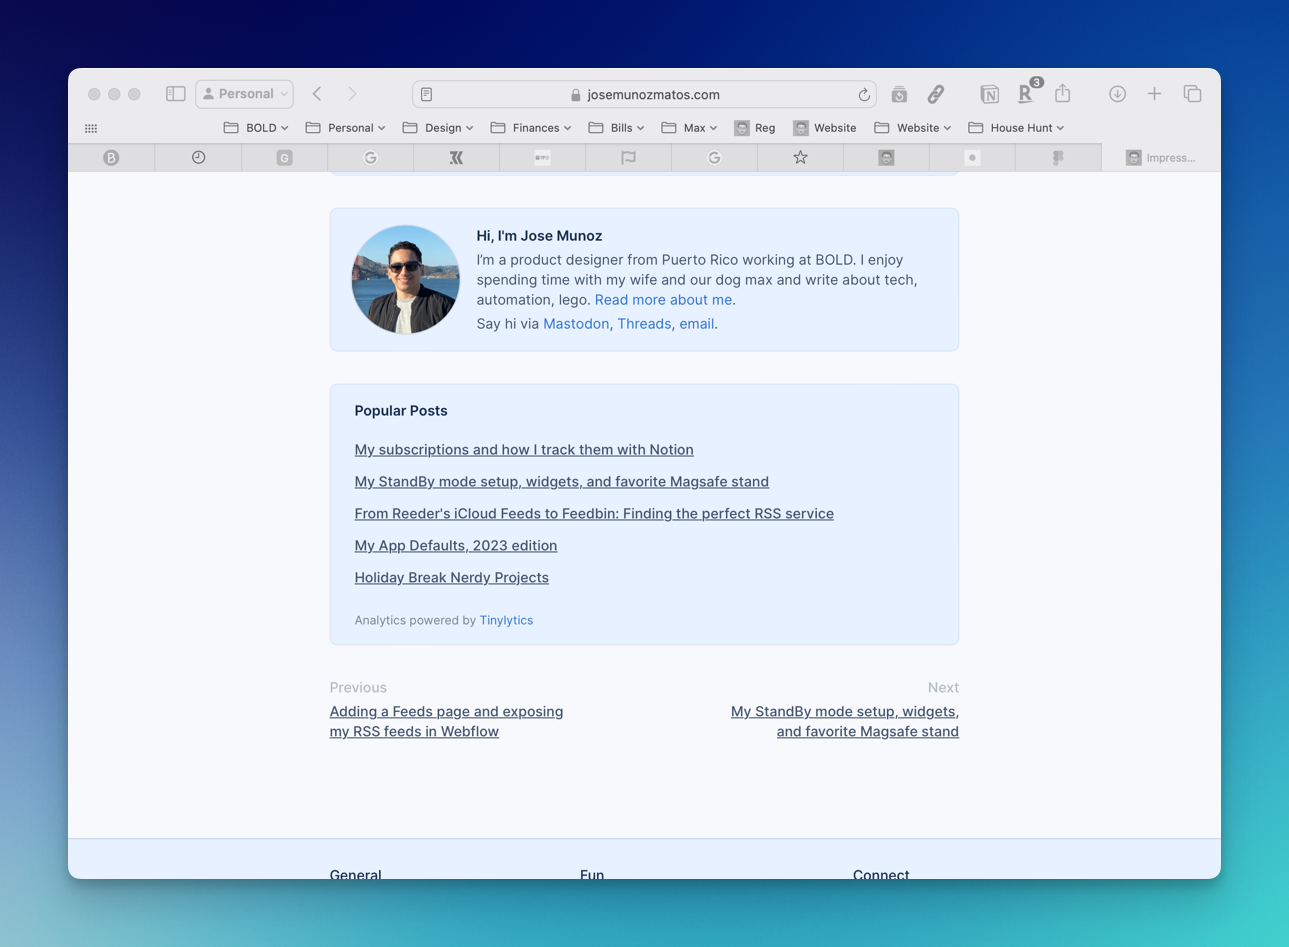
I'm pretty happy with the result. My favorite part is that it updates automatically. Sometimes, the Make scenario breaks because it makes too many requests, but they notify you instantly. If it's working, you can see the final result below at the end of the post. For now, it's mostly showing my most recent posts because, coincidentally, they are the most popular, but that might change in the future.
Let me know if you enjoyed these types of more technical blog posts. And if you end up using this guide to make your own or have any questions, please email or Mastodon.
ㅤ

I’m a product designer from Puerto Rico working at BOLD. I enjoy spending time with my wife and our dog max and write about tech, automation, lego. Read more about me.
Thanks for reading! Subscribe to to get an email whenever I post or subscribe via RSS feed.